
Data Analyst Internship Blueprint: Your First Break into Analytics

Landing your first Data Analyst internship can feel overwhelming. Between learning tools, building a resume, and preparing for interviews, it’s easy to get lost. But here’s the good news: with a clear plan and consistent practice, you can set yourself apart.
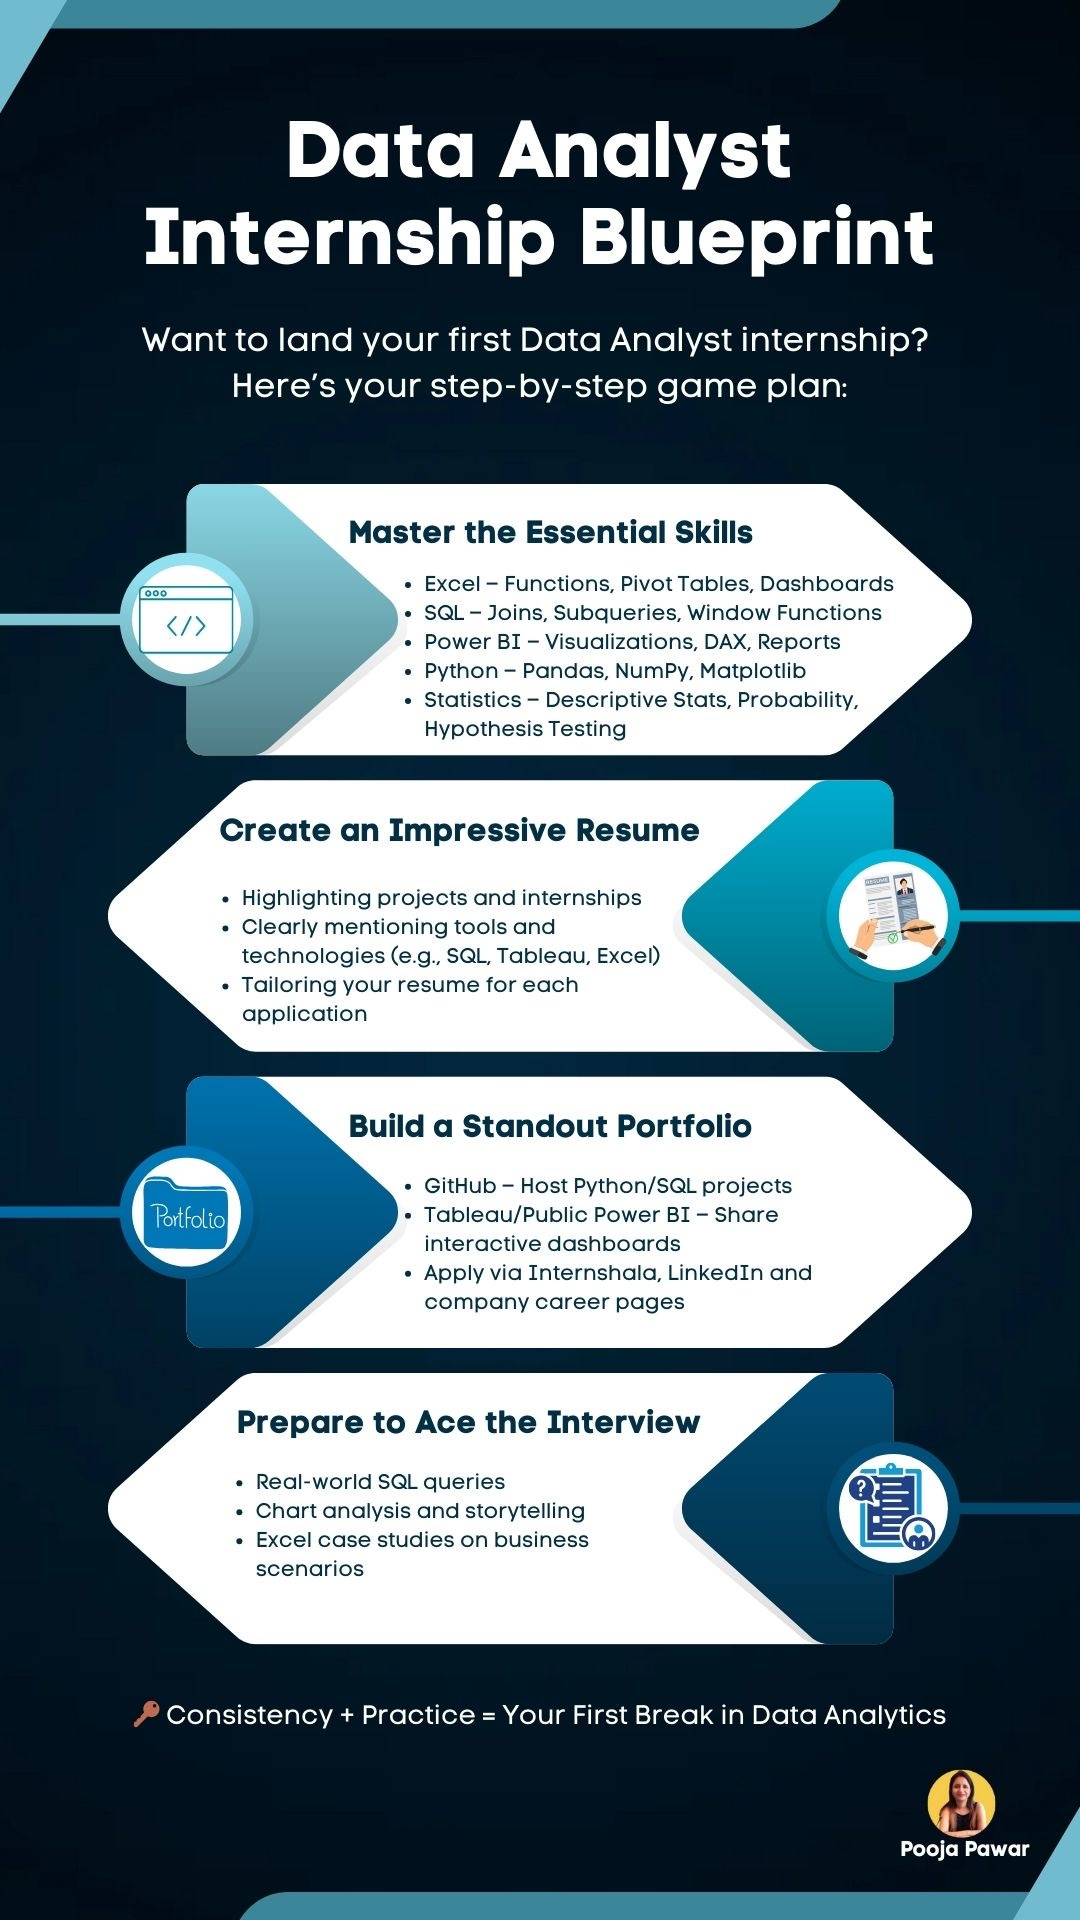
This blueprint will walk you through the essential skills, resume tips, portfolio building, and interview preparation — everything you need to move from learner to intern.
1. Build Your Foundation with Essential Skills
Every data analyst needs a strong toolkit. Think of these tools as your daily companions:
Excel
Excel is still the backbone of analytics in many companies. Learn functions like VLOOKUP, XLOOKUP, and INDEX-MATCH. Practice building PivotTables and dashboards. For example, create a sales dashboard showing monthly revenue, profit margins, and top-performing products.
SQL
SQL is your language for talking to databases. Start with SELECT queries and move up to joins, subqueries, and window functions. Imagine being asked: “Which product category brought the highest revenue in the last quarter?” That’s a real-world SQL problem.
Power BI
Power BI Visualization tools bring data to life. Learn how to create interactive reports and use DAX (Data Analysis Expressions) to add calculations. For instance, you could build a Power BI dashboard that tracks customer churn trends over time.
Python
Python expands your reach into automation and deeper analysis. Libraries like Pandas help you clean and transform datasets, NumPy supports numerical analysis, and Matplotlib allows you to create detailed charts. A simple project could be analyzing online retail sales and visualizing seasonal purchase patterns.
Statistics
Don’t just crunch numbers — understand them. Start with descriptive statistics (mean, median, standard deviation), move into probability, and practice hypothesis testing. For example, you might test whether customer satisfaction scores significantly improved after a new service feature was launched.
Don’t just learn these tools in isolation. Combine them. Pull data with SQL, clean it with Python, and visualize it in Power BI. This workflow mirrors real business scenarios.
2. Create an Impressive Resume
Recruiters spend less than 10 seconds on a resume — so clarity matters.
Highlight projects and internships
Instead of saying “Worked on Excel reports”, write “Designed a sales forecast dashboard using Excel PivotTables, improving reporting speed by 40%.” Specific results stand out.
Mention tools and technologies
Employers want to see that you know the industry standards. Add tools like SQL, Python, Tableau, Excel, or Power BI under each experience.
Tailor for each application
If a company values SQL heavily, highlight your SQL projects first. For another company, emphasize Power BI dashboards. One-size-fits-all resumes rarely work.
Use keywords from the job description. Many companies use Applicant Tracking Systems (ATS), which filter resumes based on matching terms.
3. Build a Standout Portfolio
Your portfolio is proof of your skills. Think of it as your personal showroom.
GitHub
Host your Python or SQL projects. For example, upload a Python notebook where you analyzed Twitter sentiment on a trending topic.
Tableau or Power BI Public
Publish dashboards so employers can interact with your work. Imagine sharing a dashboard that visualizes New Zealand’s housing trends or a global COVID-19 analysis — these real datasets are available publicly.
Where to Share
Apply via platforms like Internshala, LinkedIn, and company career pages. Sharing your projects on LinkedIn with short write-ups can also attract recruiters’ attention.
Pick real-world datasets. Kaggle, government open data portals, and Google Dataset Search are excellent starting points.
4. Prepare to Ace the Interview
Interviews test more than just technical skills — they test how you think.
Real-world SQL queries
Be ready for tasks like: “Find the top 5 customers who spent the most in the last year.” Practice by simulating e-commerce or banking datasets.
Chart analysis and storytelling
You may be shown a chart and asked, “What do you see here?” Employers want clarity, not jargon. For example: “This sales chart shows a seasonal dip every December, likely due to holiday closures. A promotion during this time could stabilize revenue.”
Excel case studies
Many interviews include Excel-based exercises. You might be asked to analyze a dataset of employee performance and identify trends. Practice with mock HR or sales datasets to get comfortable.
Always connect numbers back to business value. Data analysis is not just about “what happened” but “what it means for the business.”
The Power of Consistency
Landing your first internship isn’t about luck — it’s about consistency and practice. Dedicate a few hours weekly to learning, practicing, and building. Share your progress online, connect with professionals, and apply regularly.
Many successful analysts didn’t start with a computer science degree — they started with curiosity, persistence, and small projects that grew into big opportunities.
If you focus on building real skills, showing them through projects, and communicating clearly in interviews, your first break in data analytics is closer than you think.
I'm thinking about applying Excel and SQL when I start getting a better hang of the programs to some real situations at my current job. I'm moving into a leadership position, and I'm thinking about asking upper management if they'd allow me to use some of the company's data to create dashboards and track insights.