
Data Analytics Lifecycle: From Discovery to Deployment

Every business wants to turn raw data into meaningful decisions. But how does that actually happen? The data analytics lifecycle is the roadmap that transforms questions into answers, and insights into actions. Let’s walk through the six stages step by step, with real-world applications, examples, and tips that make each stage come alive.
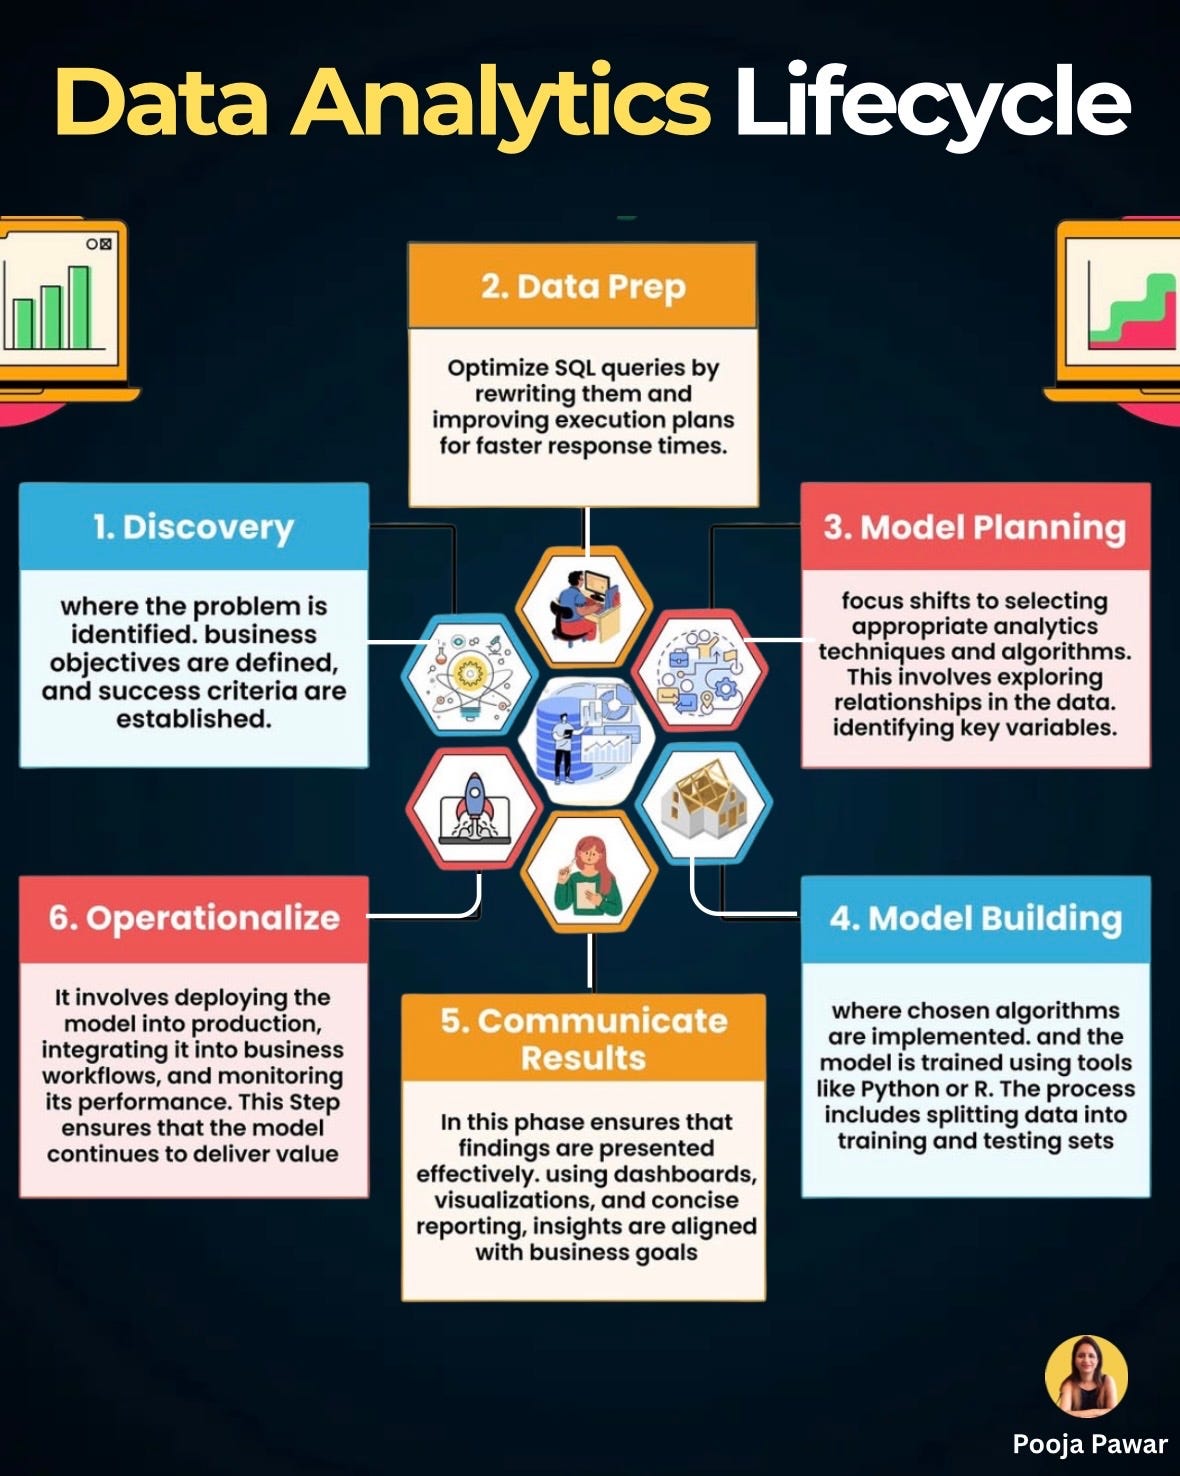
1. Discovery: Asking the Right Questions
This is where the journey begins. At this stage, analysts work with stakeholders to identify the problem, define business objectives, and set success criteria.
Theory Insight: Data analytics doesn’t start with data—it starts with a problem. Without clarity on the question, even the best analysis may miss the mark.
Example: A retail chain might ask, “Why are sales dropping in urban stores despite higher foot traffic?” That’s the discovery phase in action.
Pro Tip: Spend more time here than you think. A well-defined problem saves weeks of wasted analysis.
2. Data Preparation: Cleaning and Structuring
Once the problem is clear, the focus shifts to data preparation—collecting, cleaning, transforming, and optimizing data for analysis.
Theory Insight: Data prep typically consumes 70–80% of a project’s time. This includes removing duplicates, handling missing values, and restructuring formats.
Example: In banking fraud detection, analysts might merge transactional logs, customer demographics, and geolocation data before training a fraud detection model.
Latest Update: Tools like dbt, Snowflake, and Apache Spark are making large-scale data preparation faster and more efficient.
Pro Tip: Document every data cleaning step. Transparency builds trust in your results.
3. Model Planning: Designing the Blueprint
Here, analysts decide which techniques and algorithms to use. It’s about identifying the right relationships in the data and defining key variables.
Theory Insight: This stage bridges business understanding with mathematical rigor. Feature selection, correlation analysis, and hypothesis framing are key activities.
Example: An e-commerce platform planning a recommendation system will decide whether to use collaborative filtering, content-based filtering, or a hybrid model.
Pro Tip: Always align model planning with the end goal. If the business needs interpretability, a simple decision tree might be better than a complex deep learning model.
4. Model Building: Turning Plans into Action
This is where the chosen algorithms are implemented. Data is split into training and testing sets, and the model is trained using tools like Python, R, or Power BI’s AI visuals.
Example: A healthcare provider might build a model that predicts hospital readmission rates. The dataset is divided—80% for training, 20% for testing—to evaluate accuracy.
Latest Update: With AutoML platforms like Google Vertex AI and Microsoft Azure ML, even non-technical teams can build high-quality models faster.
Pro Tip: Don’t chase perfect accuracy—chase reliability. A slightly less accurate but more explainable model often adds more business value.
5. Communicate Results: From Numbers to Narratives
Even the best model fails if its insights aren’t communicated effectively. This stage is about dashboards, visualizations, and concise reporting.
Theory Insight: Data storytelling is as important as analysis. The goal is to ensure findings align with business goals and can be acted upon.
Example: A sales dashboard that highlights declining revenue in one region and links it to seasonal demand patterns gives executives both the “what” and the “why.”
Pro Tip: Avoid jargon. Frame results in plain language with clear business impact.
6. Operationalize: Making It Real
The final step is deployment—integrating the model into production systems, business workflows, and decision-making processes.
Example: A ride-hailing company deploys surge pricing models into its mobile app, automatically adjusting fares during high-demand periods.
Latest Update: With MLOps practices, businesses now continuously monitor models, retrain them, and update pipelines to keep performance strong.
Pro Tip: Treat deployment as the beginning, not the end. Models degrade over time; continuous monitoring is essential.
Putting It All Together
The data analytics lifecycle is not linear—it’s iterative. Discoveries in later stages may send analysts back to the beginning. What’s important is that each phase builds trust in the data and delivers actionable insights.
Quick Example Recap:
Retail store sales → Discovery
Cleaning logs and receipts → Data Prep
Choosing regression vs. classification → Model Planning
Training churn prediction model → Model Building
Visualizing churn rates in Power BI → Communicate Results
Deploying churn alerts in CRM → Operationalize
Data analytics isn’t just about technology—it’s about problem-solving, storytelling, and business value. Whether you’re a beginner analyst or a business leader, understanding this lifecycle ensures that your data projects deliver more than numbers: they deliver impact.
Which stage of the lifecycle do you find the most challenging—Discovery, Data Prep, or Deployment? I’d love to hear your thoughts.