
🧪 Hypothesis Testing: Making Sense of the Unknown!

Imagine this: You’re trying to figure out if switching from coffee to green tea has made you less productive (uh-oh!). Is it just your imagination, or is there really a difference? Hypothesis Testing is your scientific buddy that helps you find the answer!
Let’s dive into the world of hypothesis testing with Excel, where numbers come alive, and stats are fun. ☕️➡️🍵
🎯 What Is Hypothesis Testing?
Hypothesis testing is like being a detective, except you’re solving mysteries using data! You start with two guesses (hypotheses):
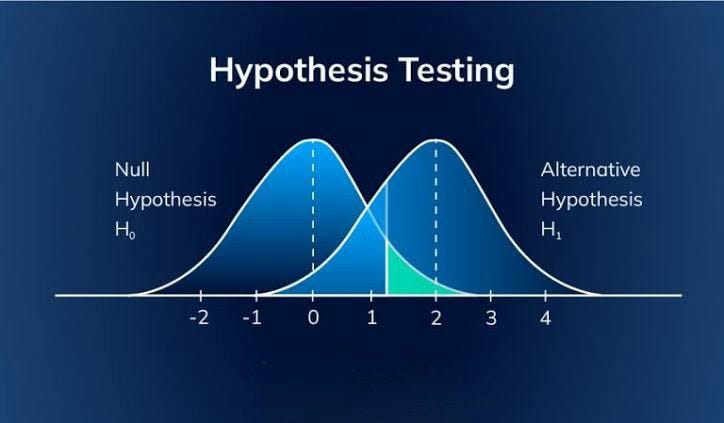
1. Null Hypothesis (H₀): No difference, nothing special is happening.
Example: Green tea has no effect on your productivity.
2. Alternative Hypothesis (H₁): There’s a difference or effect.
Example: Green tea is making you a productivity ninja.
Your mission: Use data to figure out which hypothesis is likely true.
🚀 Performing Hypothesis Tests in Excel
Excel makes hypothesis testing so simple, it feels like magic. Let’s explore some common tests:
1. T-Tests: Comparing Two Groups (T.TEST)
When to Use: Comparing two averages (e.g., productivity before and after green tea).
🛠️ How to Perform a T-Test in Excel:
1. Collect data for the two groups (e.g., pre-tea vs. post-tea productivity scores).
2. Use the T.TEST function: =T.TEST(array1, array2, tails, type)
• Array1: Data from Group 1
• Array2: Data from Group 2
• Tails: 1 for one-tailed, 2 for two-tailed
• Type: 1 for paired, 2 for independent, 3 for unequal variances
🔍 Example:
You find the p-value is 0.03 (wow, green tea actually works!). If it’s less than 0.05, you reject the null hypothesis and embrace the alternative. 🚀
2. Z-Tests: Large Sample Comparison
When to Use: Comparing means when you have a large sample size or know the population variance.
🛠️ How to Perform a Z-Test in Excel:
1. Download an Excel add-in or calculate manually (Excel doesn’t have a direct Z.TEST function).
2. Use the formula for the Z-test statistic:
Z = (Mean1 - Mean2) / (Standard Error)
3. Compare the Z-value to the standard normal distribution.
3. Variance Testing: F-Test (F.TEST)
When to Use: Checking if two groups have similar variances (e.g., consistent productivity in morning vs. afternoon shifts).
🛠️ How to Perform an F-Test in Excel:
1. Use the F.TEST function:
=F.TEST(array1, array2)
• Array1: Data from Group 1
• Array2: Data from Group 2
🔍 Example:
If the F-test gives a low p-value (< 0.05), the variances are significantly different. Otherwise, they’re pretty similar.
🌟 Why Symbols and Fun Matter in Hypothesis Testing
Let’s add a sprinkle of magic to this stats journey:
• H₀ (Null Hypothesis): The skeptic 👀
• H₁ (Alternative Hypothesis): The dreamer 🌈
• p-value: Your decision-maker 🤔
• p < 0.05: Time to party 🎉 (reject H₀)
• p > 0.05: Better luck next time! 😅
📊 Wrapping It All Up
Hypothesis testing may sound intimidating, but with Excel and some curiosity, it becomes a piece of cake 🍰. Here’s your cheat sheet:
1. T-Test: Compare averages
2. Z-Test: Large sample means
3. F-Test: Variance comparison
So, next time you’re stuck wondering if green tea or coffee is your real BFF, just fire up Excel and let the numbers decide!
✨ Comment below: What’s your favorite test in Excel? Or share your hypothesis-testing adventure! 🚀