
📊 Hypothesis Testing with p-values: A Simple and Fun Guide! 🎯

Hello, data enthusiasts! 📈 Ready to uncover the magic behind p-values and how they’re used in hypothesis testing? Whether you’re a data analyst, a student, or just curious, this post will make the journey enjoyable and easy to digest. Let’s dive in! 🚀
Step 1: Hypothesis Testing 🎭
Before we talk about p-values, let’s revisit what hypothesis testing is.
Imagine you’re a detective 🕵️♂️ investigating a claim:
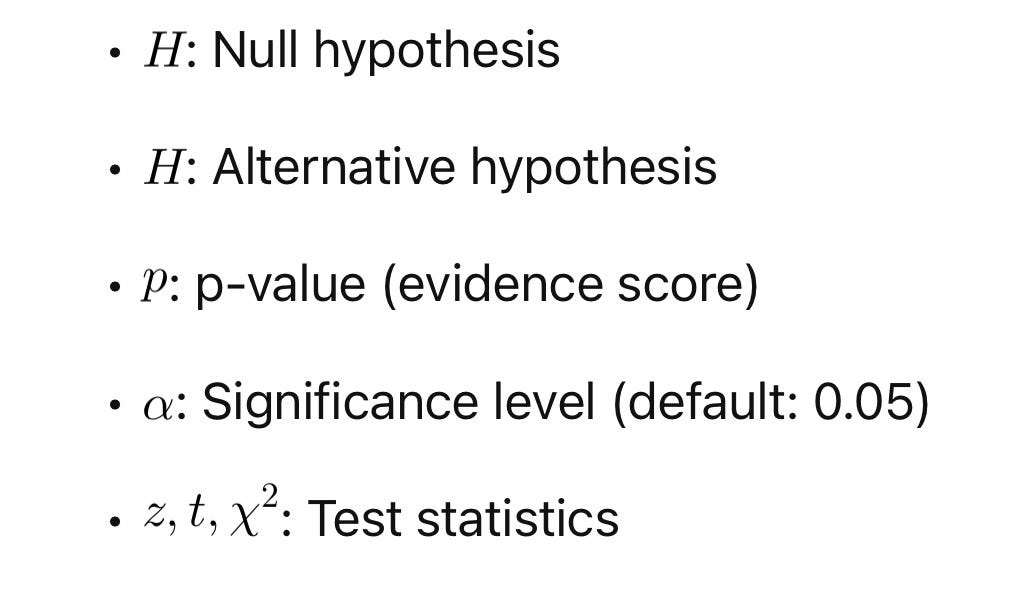
Null Hypothesis (H₀): Nothing’s going on here, it’s all just random noise. 💤
Alternative Hypothesis (H₁): Nope, there’s something interesting happening! 🚨
Your mission? Use data to decide whether to keep H₀ or switch to H₁. Simple enough, right?
Step 2: Meet the p-value 🤝
The p-value is like your “evidence score.” 📝
It tells you how likely you’d see your data if H₀ were true.
• High p-value: “Hmm, this could just be random. Maybe H₀ is true.” 🧐
• Low p-value: “Whoa, this is unlikely to happen by chance! H₁ might be onto something.” 🔥
How Low is Low? The Significance Level (α) 📉
The standard cutoff is 0.05 (aka 5%). Think of it like this:
• If p < 0.05, it’s like a 🚦 green light for rejecting H₀.
• If p ≥ 0.05, you pump the brakes 🚫 and stick with H₀.
Step 3: Calculating p-values 📐
Let’s crunch some numbers! Here’s how you calculate p-values for popular tests:
🧪 1. Z-test (e.g., comparing a sample mean to a population mean):
1. Compute the z-score:
Where:
• : Sample mean
• : Population mean
• : Standard deviation
• : Sample size
2. Use a z-table or statistical software to find the p-value for your z-score.
🧪 2. t-test (e.g., comparing two sample means):
1. Compute the t-score:
Where:
• : Sample means
• : Standard deviations
• : Sample sizes
2. Use a t-table or software to get the p-value.
🧪 3. Chi-square test (e.g., testing independence in categorical data):
1. Compute the chi-square statistic:
Where:
• : Observed values
• : Expected values
2. Use a chi-square distribution table to find your p-value.
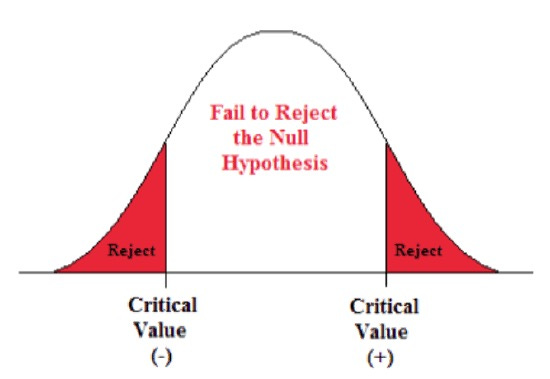
Step 4: Interpreting p-values 📖
🟢 Case 1: p < 0.05 (Statistically Significant!)
“Wow, this result is unlikely under H₀. Time to reject H₀ and accept H₁.” 🚀
🔴 Case 2: p ≥ 0.05 (Not Significant)
“Hmm, this data doesn’t give enough evidence to reject H₀. Let’s stick with it for now.” 🛑
Make It Fun with Examples! 🎉
Let’s say you’re testing a new drug 💊:
• H₀: The drug has no effect.
• H₁: The drug works wonders! 🌟
After running your experiment:
• If : The drug seems to work! Let’s reject H₀ and pop the champagne. 🥂
• If : Not enough evidence yet. Maybe try another experiment. 🧪
Quick Summary 📝
1. Hypothesis testing helps decide between H₀ and H₁.
2. The p-value measures the strength of evidence against H₀.
3. Compare the p-value to α (usually 0.05):
• : Reject H₀.
• : Fail to reject H₀.
Symbols Cheat Sheet 🛠️
Pro Tip for Data Lovers 📊
Always pair your p-value with the effect size and confidence intervals for a more complete picture. Numbers without context can mislead! 🚦
Was that fun or what? Hypothesis testing doesn’t have to be scary! If you have questions or need clarification, drop a comment below. Let’s make data fun, one post at a time! 💡