
Learn Python and Machine Learning the Smart Way

Machine Learning (ML) and Python have become the backbone of data-driven industries. Whether you want to analyze markets, automate processes, or design intelligent applications, the path begins with building strong foundations and gradually advancing into specialized tools. Let’s break down this journey step by step, adding theory, examples, and tips along the way.
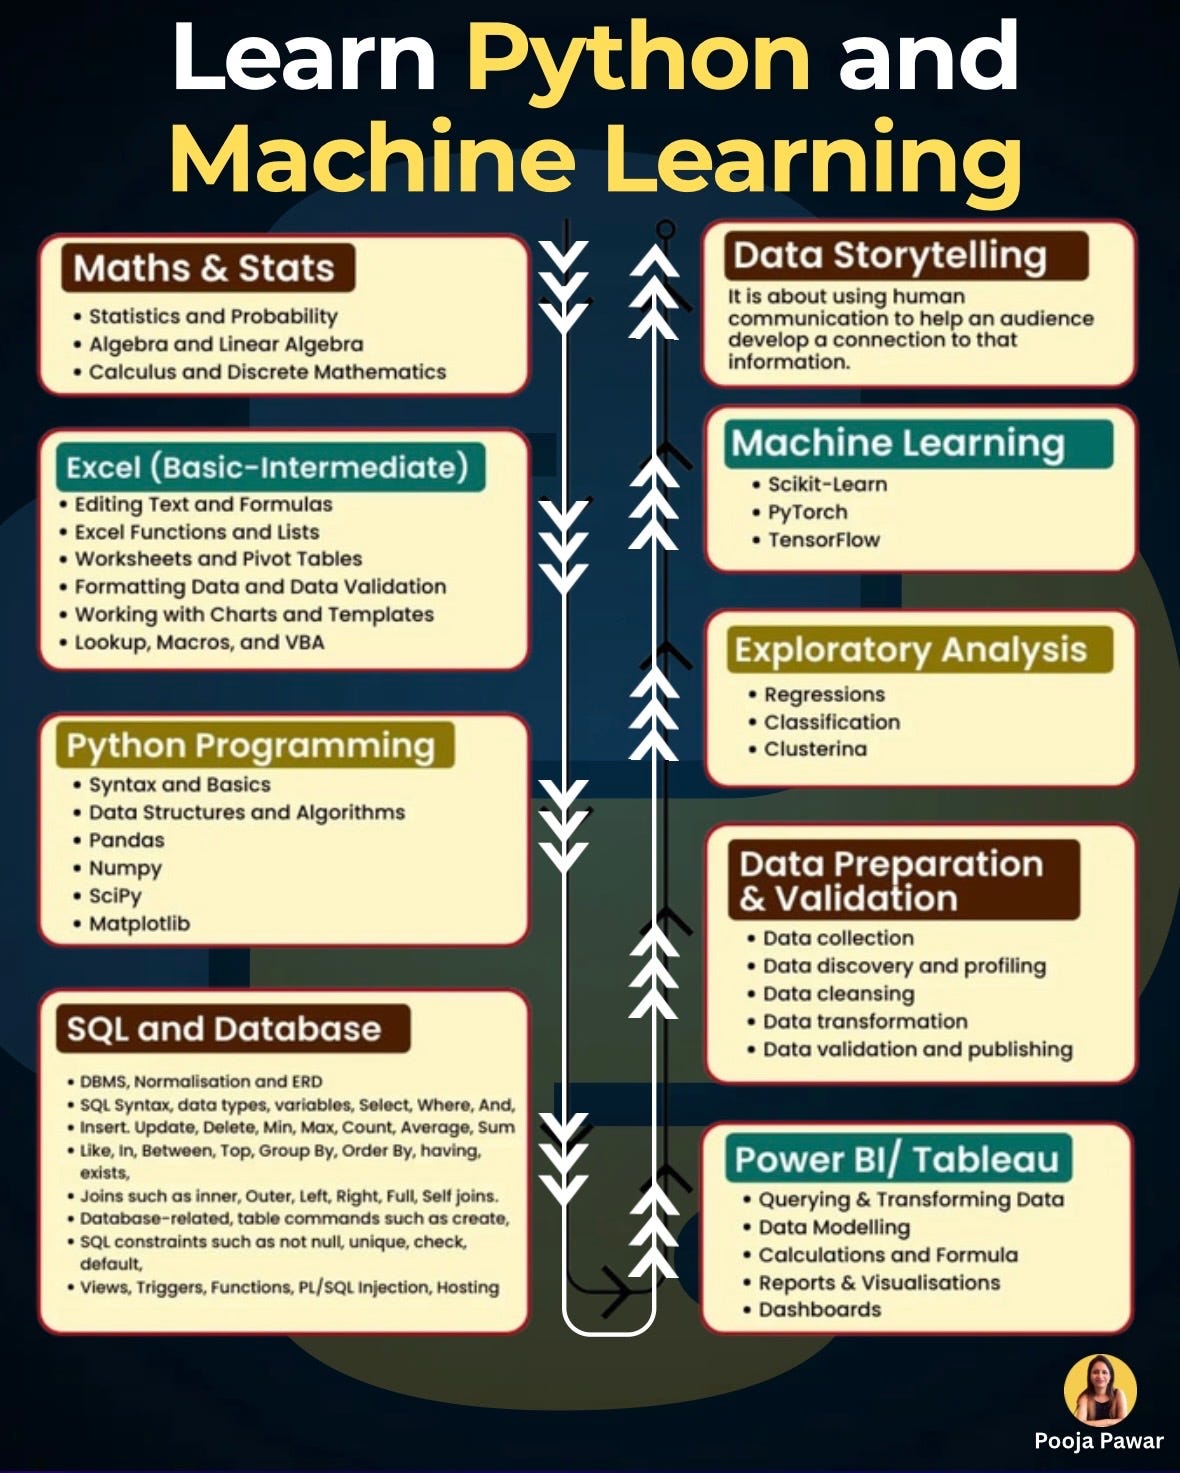
Maths & Statistics: The Language of Data
Behind every ML model lies math. Without it, algorithms feel like black boxes.
Statistics & Probability: Think of predicting customer churn. You’ll rely on probability distributions to model the likelihood of a customer leaving.
Algebra & Linear Algebra: Vector operations are the engine of ML. When Netflix recommends a movie, it’s linear algebra mapping your preferences into multidimensional vectors.
Calculus & Discrete Mathematics: Optimization in ML (like gradient descent) is calculus in action. Discrete math powers decision trees and graph-based algorithms.
Don’t try to master everything at once. Focus on the concepts directly linked to ML — like matrix operations, probability distributions, and derivatives.
Excel (Basic to Intermediate): Still Relevant in the Age of Python
Excel might not sound “advanced,” but it remains one of the most practical tools for analysts and beginners.
Editing Formulas & Functions: SUMIF, VLOOKUP, and XLOOKUP help answer business questions like “Which product brought in the highest revenue last quarter?”
Pivot Tables: Great for slicing large datasets quickly. Example: Summarize sales by region with just a few clicks.
Charts & Templates: Visuals like bar graphs or waterfall charts make data digestible for decision-makers.
Macros & VBA: Automating repetitive reporting saves hours of manual work.
Latest Update: Excel now integrates with Python (through Microsoft 365). This bridges the gap between everyday analysis and advanced ML pipelines.
Python Programming: From Basics to Data Science
Python is the lifeblood of ML — flexible, readable, and packed with libraries.
Syntax & Basics: Start simple. For example, write a loop to calculate average grades for a class.
Data Structures & Algorithms: Lists, dictionaries, and sets aren’t just academic — they’re used in web scraping, log analysis, and even ML preprocessing.
Libraries:
Pandas for data cleaning (turning messy CSVs into clean datasets).
NumPy for numerical arrays (matrix math at scale).
SciPy for advanced computations (signal processing, optimization).
Matplotlib for visuals (line charts, scatter plots, histograms).
Example: Imagine cleaning thousands of rows of survey data — Pandas makes it possible to handle in minutes what would take hours in Excel.
SQL & Databases: The Bedrock of Data Storage
Before you build models, you need clean, structured data. That’s where SQL shines.
Core Syntax: SELECT, WHERE, GROUP BY — imagine finding the “top 5 customers by spending in the last 6 months.”
Joins: Combine datasets like sales and customer demographics to gain deeper insights.
Constraints & Views: Ensure data integrity and simplify queries for regular use.
Hosting & ERDs: Visualize relationships and manage databases at scale.
Real-world scenario: An e-commerce platform may query millions of orders daily. SQL ensures accurate, fast retrieval.
Data Preparation & Validation: Garbage In, Garbage Out
Most ML failures happen before modeling even begins — due to messy data.
Data Collection: Scraping APIs, pulling from databases, or importing CSVs.
Data Discovery: Profiling datasets to identify missing values, duplicates, or skewed distributions.
Data Cleansing: Removing outliers, handling null values, standardizing formats.
Data Transformation: Converting text to numbers (one-hot encoding) or normalizing scales for algorithms.
Validation & Publishing: Ensuring datasets meet business requirements before they’re modeled.
Data scientists spend up to 70% of their time on cleaning and preparing data.
Exploratory Analysis: The Detective Phase
Exploratory Data Analysis (EDA) is about asking questions before algorithms do.
Regressions: Predict sales based on marketing spend.
Classification: Classify whether a loan will default or not.
Clustering: Segment customers into groups for personalized campaigns.
Example: An airline analyzing flight delays might use clustering to identify hidden patterns like “weather vs. mechanical issues.”
Machine Learning: The Core Engines
This is where theory meets practice.
Scikit-Learn: Ideal for quick prototyping (linear regression, decision trees, k-means clustering).
PyTorch: Preferred for deep learning research — powering innovations in NLP and computer vision.
TensorFlow: Widely used in production-grade ML systems, from Google Translate to self-driving cars.
Example: A hospital predicting patient readmissions may start with logistic regression (Scikit-Learn) before scaling to deep learning with TensorFlow.
Power BI & Tableau: Communicating Insights
Numbers don’t matter until they tell a story. That’s where BI tools shine.
Querying & Transforming Data: Import data directly from SQL or Excel.
Data Modelling: Create relationships across datasets.
Reports & Dashboards: Share real-time KPIs like “Daily Sales vs Target.”
Formulas & Calculations: Use DAX (in Power BI) or calculated fields (in Tableau) to derive new insights.
Latest Trend: Tableau is embedding AI-driven insights, while Power BI integrates more tightly with Azure and Microsoft Fabric.
Data Storytelling: The Human Side of Analytics
At the end of the pipeline, storytelling brings it all together.
Why It Matters: Executives don’t care about algorithms; they care about impact.
How It Works: Blend charts, narratives, and relatable analogies. Instead of saying “sales dropped 15%,” say “we lost the equivalent of three full product launches this quarter.”
Examples: Spotify Wrapped is a perfect case of data storytelling — turning user data into personalized, shareable stories.
Learning Python and Machine Learning isn’t just about algorithms or dashboards. It’s about connecting math, data, tools, and human communication into one ecosystem. The journey is iterative — you’ll bounce between SQL queries, Python scripts, BI dashboards, and ML models before finally turning numbers into stories that drive decisions.
The best part? Every skill you add builds a layer of confidence. From cleaning a CSV in Pandas to presenting a polished dashboard in Power BI, you’re not just learning tools — you’re learning how to think in data.
Thank you