
🎯 Mastering Sampling and Data Analysis in Excel: Random, Stratified and More!

When it comes to data analysis, sampling is like picking the best chocolates from a box to decide if it’s worth buying the whole thing 🍫. It saves time, effort, and often sanity! Let’s dive into some fun and practical ways to learn Random Sampling Techniques, use Excel’s magical RAND and RANDBETWEEN functions, perform Stratified Sampling, and draw meaningful insights from samples—all while keeping it light and engaging!
🎲 Random Sampling Techniques: Start Small, Think Big
Random sampling is the backbone of statistics—it’s like picking random pages from a book to decide if it’s worth reading 📖. Here’s why it’s awesome:
• It reduces bias 🎯.
• Saves time when analyzing massive datasets 🕒.
• Represents the population accurately without examining every single data point.
Example:
Imagine analyzing customer reviews on 10,000 products. Instead of reading every single review, you randomly select 500. That’s random sampling at work, saving you countless hours!
🧙♂️ Excel Magic: RAND and RANDBETWEEN
Excel makes random sampling super easy with two powerful functions: RAND and RANDBETWEEN.
🪄 RAND Function
The =RAND() function generates a random number between 0 and 1. Here’s how to use it:
1. Add a new column in your dataset.
2. Type =RAND() in the first cell and drag it down to apply it to all rows.
3. Sort your data by this column (ascending or descending).
4. Select the top X rows for your random sample. Done! 🎉
🎲 RANDBETWEEN Function
The =RANDBETWEEN(min, max) function generates random whole numbers between your chosen minimum and maximum values.
Example:
If you have employee IDs ranging from 1001 to 2000 and need to pick 10 random employees, simply use:
=RANDBETWEEN(1001, 2000)
Repeat this 10 times to get your sample.
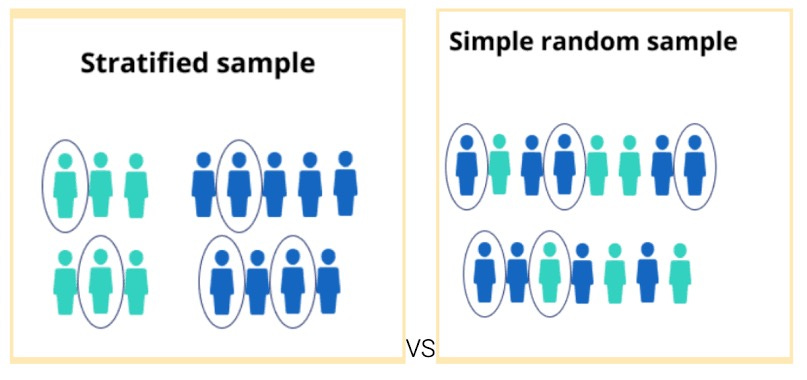
🍰 Stratified Sampling with Conditional Formulas
Sometimes random sampling isn’t enough—you need stratified sampling to ensure all key groups are represented. Think of it as picking desserts from different sections of a buffet 🍩🍦🍰.
Why Stratified Sampling?
• Ensures every subgroup is represented 🧩.
• Useful when data varies significantly across groups (e.g., age groups, departments).
Example:
Let’s say you’re studying employees across departments and want each department to be equally represented in your sample. This is where stratified sampling shines.
How to Do It in Excel:
1. Add a column for your strata (e.g., department).
2. Use the =COUNTIF() function to calculate the total for each group.
3. Assign a proportionate number of samples to each group.
4. Use the =RAND() function within each group to randomly select rows.
Pro Tip: Filter your data by strata and apply random sampling to each filtered group for accuracy.
🔍 Drawing Inferences from Samples
Once you’ve collected your sample, the real fun begins—analyzing it! Here’s how:
1. Calculate Key Metrics:
Start with the basics like mean, median, and standard deviation. Use formulas like =AVERAGE(range) and =STDEV(range) to compute these metrics.
2. Compare with the Population:
Check if the sample metrics align with the overall population metrics. If they’re close, congratulations—you’ve got a representative sample!
3. Confidence Intervals:
Add credibility to your analysis by calculating confidence intervals. It’s like saying, “I’m 95% sure this chocolate box has more hazelnut truffles than caramel ones 🍫.”
🛠️ Excel Formula Recap
Here’s a quick roundup of the key Excel formulas for sampling and analysis:
• =RAND(): Generates random decimals for random sampling.
• =RANDBETWEEN(): Generates random whole numbers for sampling IDs or specific values.
• =COUNTIF(): Counts specific items in a range (great for stratified sampling).
• =AVERAGE(): Finds the mean of your sample data.
• =STDEV(): Measures variability in your sample.
💡 Final Thoughts
Sampling doesn’t have to be a dry, number-crunching task. With Excel’s versatile tools and a bit of creativity, you can make it efficient and even fun! Whether you’re exploring customer reviews, employee data, or survey responses, sampling helps you uncover meaningful insights without drowning in data.
So next time you face a mountain of information, grab your sampling tools and start analyzing like a pro. Happy sampling! 🎉
Got questions or fun sampling stories? Share them in the comments below! Let’s make data analysis exciting together! 🚀