
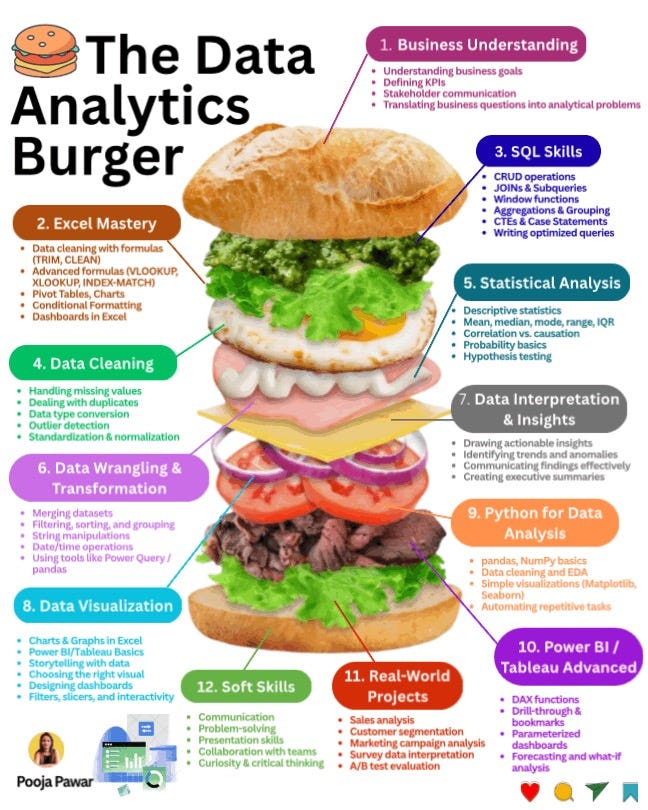
The Data Analytics Burger: Building Skills Layer by Layer

Every data analyst’s journey can feel overwhelming—so many tools, techniques, and concepts to learn. But what if we stacked these skills like the layers of a burger? Each bite adds flavor, and together, it creates a complete meal.
This “Data Analytics Burger” isn’t just a metaphor—it’s a roadmap. Let’s break it down layer by layer, with examples, facts, and the latest updates from the data world.
1. Business Understanding – The Top Bun
Every burger starts with the bun, holding everything together. Similarly, business understanding anchors analytics.
Theory: Analytics without context is noise. You need to understand business goals, key performance indicators (KPIs), and how stakeholders measure success.
Example: A retail company doesn’t just want sales numbers. They want to know why one region outperforms another and how promotions influence repeat customers.
Latest Update: With AI adoption booming, analysts are now expected to not only define KPIs but also align them with AI-driven forecasts and scenario planning.
2. Excel Mastery – The Lettuce & Tomato
Excel might feel old-school, but it’s still the fresh crunch in the analytics burger.
Theory: Excel builds the foundation—cleaning, formatting, and analyzing data at scale. Advanced formulas bring flexibility, while pivot tables offer quick insights.
Example: A startup tracking website traffic can use VLOOKUP and Pivot Tables to analyze referral sources without expensive tools.
Tip: Excel dashboards, when well-designed, can rival lightweight BI tools. Add conditional formatting and slicers to make data pop.
3. SQL Skills – The Juicy Patty
SQL is the protein of analytics—it provides substance.
Theory: Almost all data pipelines run through SQL at some stage. Knowing joins, aggregations, and window functions is non-negotiable.
Example: To analyze churn, a telecom analyst might use SQL to pull user history, join with support tickets, and calculate churn probability by region.
Fact: LinkedIn’s 2025 skill report ranks SQL in the top three must-have skills for data professionals worldwide.
4. Data Cleaning – The Cheese
Cheese melts everything together—and data cleaning makes analysis possible.
Theory: Real-world data is messy: duplicates, missing values, inconsistent formats. Cleaning ensures reliable outputs.
Example: A survey dataset with “USA,” “U.S.A,” and “United States” as entries must be standardized before generating country-level insights.
Latest Update: Tools like OpenRefine and Python libraries (pandas) are now widely used alongside Excel for semi-automated cleaning.
5. Statistical Analysis – The Onion
Onions add sharpness—statistics add depth.
Theory: Descriptive stats summarize data, while hypothesis testing and probability provide decision-making confidence.
Example: An e-commerce company tests whether offering free shipping increases sales using A/B hypothesis testing.
Tip: Don’t just memorize formulas—practice applying them to real datasets.
6. Data Wrangling & Transformation – The Pickles
Pickles cut through the heaviness—wrangling keeps data crisp.
Theory: Data wrangling involves reshaping, merging, and converting raw data into usable form.
Example: A marketing team combines ad spend, sales, and customer engagement into one dataset using Python’s pandas merge functions.
Latest Update: Low-code platforms like Alteryx are gaining traction, letting non-coders wrangle data efficiently.
7. Data Interpretation & Insights – The Sauce
This is where the flavor kicks in—your insights must stick.
Theory: It’s not enough to crunch numbers. Analysts must tell stories with data, identifying patterns and trends stakeholders can act on.
Example: A hospital analyzing patient wait times can turn raw numbers into actionable insights: reducing wait times by adding weekend staff.
Tip: Always communicate findings in plain language backed with visuals.
8. Data Visualization – The Fresh Greens
Visualization is the garnish that makes data appealing.
Theory: Good visualization reveals trends hidden in raw numbers. It turns complexity into clarity.
Example: Instead of a table, a line chart showing monthly churn immediately highlights seasonal spikes.
Fact: Gartner predicts that by 2026, 70% of business users will rely on dashboards created by analysts rather than raw reports.
9. Python for Data Analysis – The Extra Patty
For a double-layered punch, Python powers deeper analysis.
Theory: Python extends Excel and SQL with automation, advanced visualization, and machine learning.
Example: Using pandas, analysts can clean millions of rows in seconds—something Excel would struggle with.
Tip: Libraries like matplotlib and seaborn make visualizations richer, while automation frees analysts from repetitive tasks.
10. Power BI & Tableau Advanced – The Special Sauce
BI tools elevate insights to the boardroom.
Theory: Beyond dashboards, advanced features like DAX in Power BI or calculated fields in Tableau provide deeper analytics.
Example: A financial analyst uses Power BI’s what-if parameter to model different interest rate scenarios.
Latest Update: Tableau’s AI-driven “Einstein Discovery” and Power BI’s Copilot are transforming how dashboards are built.
11. Real-World Projects – The Fries on the Side
A burger meal isn’t complete without fries—and your skills aren’t complete without projects.
Examples of Projects:
Sales forecasting for a retail chain
Marketing campaign analysis for click-through rates
A/B testing for website redesign impact
Tip: Showcase projects on GitHub or a personal portfolio. Recruiters value practical applications over certifications alone.
12. Soft Skills – The Bottom Bun
The base bun holds the burger together—soft skills hold your career together.
Theory: Communication, problem-solving, and collaboration ensure your insights make impact.
Example: An analyst who presents findings clearly to executives secures funding for future projects.
Fact: Surveys show 70% of analytics hiring managers prioritize communication skills alongside technical expertise.
The Data Analytics Burger is more than a fun analogy—it’s a career roadmap. Each layer adds flavor, texture, and structure to your skillset. The more balanced your burger, the stronger your career will be.
Don’t rush to add extra patties (Python, BI tools) before you’ve secured the buns (business understanding and soft skills).
Onions add the bite. Sometimes make you tear up, but they’re what turns raw data into real insight.