
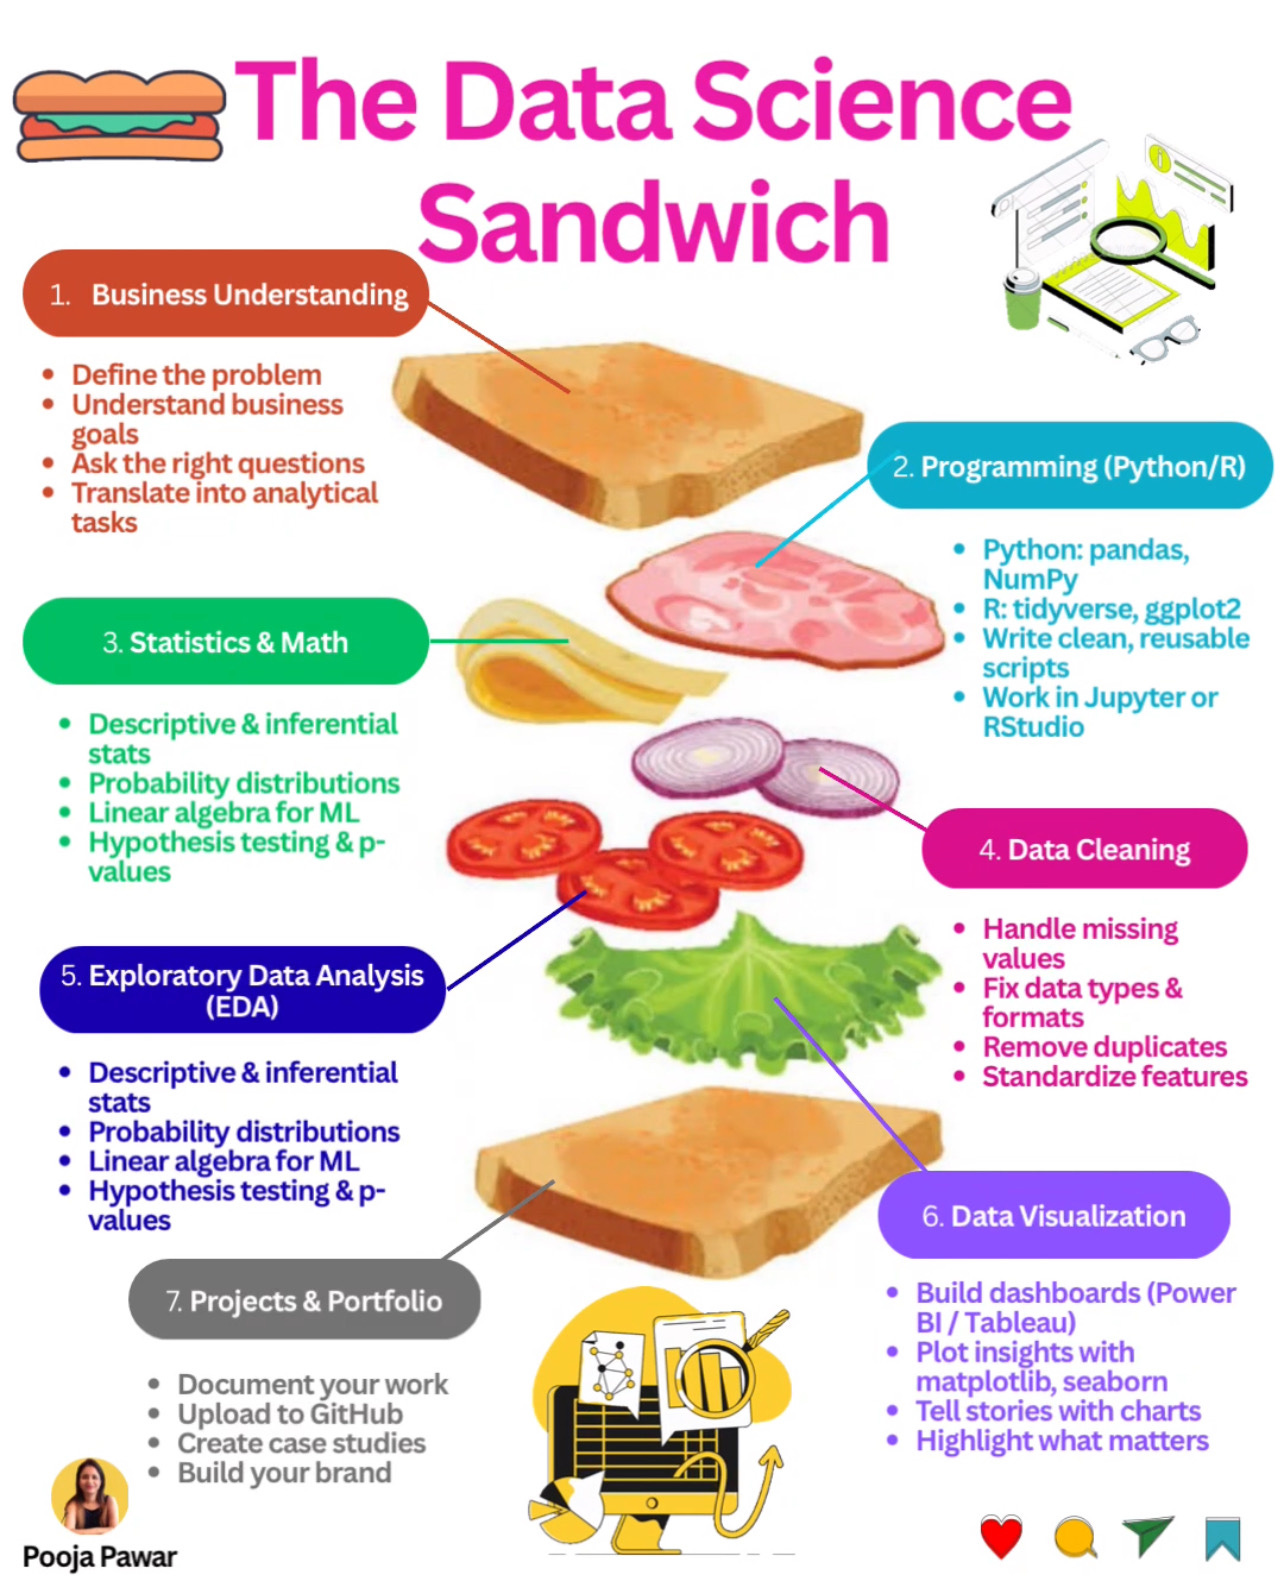
The Data Science Sandwich: From Bread to Brilliance

When people hear “data science,” they often imagine complex algorithms and AI models. But just like a sandwich, data science is about layering the right ingredients in the right order to create something valuable. Leave out one layer, and the whole thing feels incomplete.
Let’s break down the “Data Science Sandwich” into each delicious layer, adding real-world examples, practical tips, and the latest industry updates.
1. Business Understanding – The Foundation Bread
Every data science project begins not with code, but with clarity.
Define the problem: Are you predicting customer churn? Optimizing supply chains? Detecting fraud?
Understand business goals: Netflix doesn’t just build recommendation systems for fun; their aim is reducing user churn by keeping viewers engaged.
Ask the right questions: Instead of asking “How can we use AI?”, ask “How can AI increase customer retention by 5%?”
Always reframe technical tasks into measurable business objectives. For instance, instead of “build a predictive model,” say “predict 80% of likely churners within the next 3 months.”
2. Programming (Python/R) – The Meat
Once the problem is clear, we turn to tools.
Python: Widely used for data manipulation with pandas and NumPy, plus ML libraries like scikit-learn and TensorFlow.
R: Strong in statistical analysis, visualization, and packages like tidyverse and ggplot2.
Example in practice:
Airbnb analysts use Python’s pandas to clean millions of booking records, while statisticians at the CDC often rely on R for public health trend analysis.
Latest update: In 2025, Python 3.13 introduced performance boosts that make handling large datasets 10–15% faster, closing the gap with specialized big data tools.
3. Statistics & Math – The Cheese and Pickles
Without statistics, machine learning is just guesswork.
Descriptive & inferential stats: Understand averages, trends, and make predictions.
Probability distributions: From the normal distribution (stock returns) to the Poisson distribution (number of customer complaints per hour).
Linear algebra: Vectors and matrices power ML algorithms like recommendation engines.
Hypothesis testing & p-values: Crucial for A/B testing—think of e-commerce sites testing two homepage designs.
Real-world example: Amazon uses hypothesis testing to validate whether a new delivery option increases customer satisfaction.
4. Data Cleaning – The Lettuce & Tomato
Data scientists often joke that 80% of their time goes into cleaning data.
Handle missing values: Do you drop them, fill them, or model them?
Fix data types & formats: Converting “01/09/25” correctly across regions (is it Jan 9 or Sep 1?).
Remove duplicates & standardize features: Especially critical in healthcare where duplicate records can distort patient outcomes.
Case study: During COVID-19, governments faced huge challenges cleaning testing and vaccination data coming from multiple labs with inconsistent formats.
5. Exploratory Data Analysis (EDA) – The Onions
EDA is where insights start to appear.
Visualization & summary stats: Histograms, scatter plots, and box plots reveal hidden trends.
Example: A telecom company plotting call durations discovered spikes on weekends, leading to weekend bundle offers.
Advanced EDA: Use correlation heatmaps to check variable relationships before modeling.
Always validate surprising patterns. A sudden spike in sales could be a seasonal trend—or a data entry error.
6. Data Visualization – The Sauce
Even the best analysis fails if stakeholders can’t understand it.
Dashboards: Tools like Power BI and Tableau bring insights to life.
Storytelling with charts: Instead of overwhelming with 20 charts, highlight the 2 that matter most.
Latest trends: In 2025, BI tools are integrating AI-generated narratives (text explanations auto-generated alongside dashboards).
Example: Spotify uses dashboards to track listening trends across regions, which informs playlist curation and even artist promotion.
7. Projects & Portfolio – The Final Bread
This is where everything comes together.
Document your work: Write detailed case studies on GitHub or personal blogs.
Create end-to-end projects: Example: Predicting housing prices → cleaning raw data, running EDA, building ML models, and deploying a visualization dashboard.
Build your brand: Share projects on LinkedIn, Medium, or Substack. Recruiters value proof of execution more than certificates.
Latest update: Many companies now test candidates with take-home projects instead of traditional whiteboard interviews. Having a polished portfolio gives you a major edge.
Just like a sandwich, data science requires every layer. Skip the bread (business understanding) or ignore the sauce (visualization), and the result won’t satisfy. But when each ingredient is in place, you deliver not just insights—but impact.
Don’t rush to algorithms. The secret to great data science lies in balancing business context, technical skill, statistical thinking, and clear communication.
Great analogy!