
Why Excel is Still a Powerhouse for Data Analysts

For years, people have debated whether Excel is becoming obsolete in the era of SQL, Python, and advanced BI tools. But here’s the truth—Excel remains one of the most essential tools for data analysts. Whether you’re cleaning data, analyzing trends, or presenting insights, Excel offers flexibility, ease of use, and a vast range of functions that other tools often can’t match in day-to-day business scenarios.
So, why is Excel still relevant in 2025? Let’s dive into its strengths, compare it with other popular tools, and explore real-world use cases where Excel continues to shine.
Excel’s Strengths and Limitations: The Reality Check
Why Excel is Still a Go-To Tool for Data Analysts
Despite the rise of SQL, Power BI, and Python, Excel continues to dominate because of several reasons:
Excel is intuitive and doesn’t require coding knowledge to get started.
It allows immediate data analysis without the need for setting up databases or configurations.
Built-in functions and tools like PivotTables, conditional formatting, and formula-driven logic help in fast decision-making.
It provides excellent features for cleaning data such as removing duplicates, handling blanks, and splitting or combining data quickly.
Excel integrates well with other tools like Power BI, SQL, and even Python, making it a versatile part of any analyst’s toolkit.
In most business environments, Excel is still the default tool for reporting, financial tracking, and analysis.
Limitations of Excel
That said, Excel does have its limitations:
Handling very large datasets can be difficult and may lead to file crashes or slow performance.
Workbooks with complex formulas and multiple PivotTables can become sluggish.
Not all users have access to the latest version, causing compatibility issues.
Excel is not ideal for automating repetitive tasks at scale compared to scripting languages like Python or using SQL procedures.
Even with these limitations, Excel continues to be valuable when used within its strengths.
Excel vs. SQL vs. Power BI: Where Each Tool Wins
Many people ask: If SQL and Power BI exist, do we really need Excel? The answer is yes—each tool serves a different purpose.
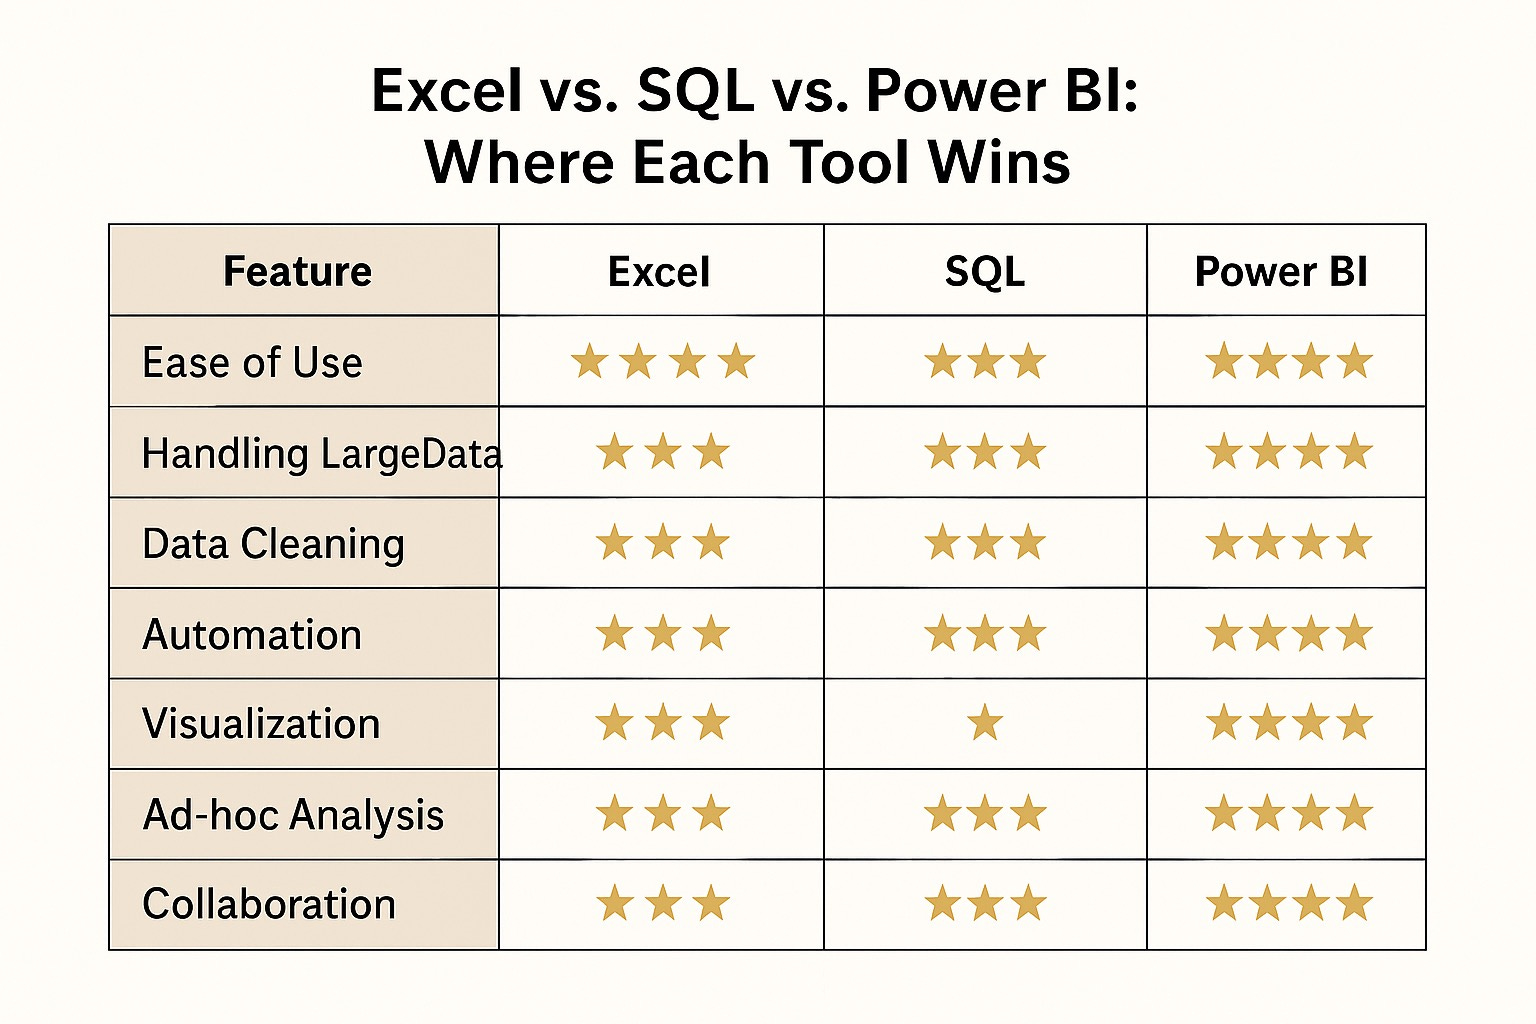
Where Each Tool Excels
Excel is best suited for quick, on-the-fly analysis and lightweight dashboards.
SQL excels at querying and managing large-scale structured data.
Power BI is ideal for interactive dashboards, data storytelling, and sharing reports across organizations.
Example:
If a sales manager needs a quick report on last month’s sales trends, Excel is the fastest option. For long-term trend analysis across multiple years, SQL combined with Power BI would be more suitable
Real-World Use Cases: When Excel is the Best Choice
Even in 2025, Excel is still irreplaceable in certain scenarios. Here are some real-world situations where Excel proves its worth:
1. Financial Modeling and Forecasting
Companies use Excel extensively for budgeting, cash flow projections, ROI calculations, and scenario analysis.
Example: A finance team models three revenue scenarios for the next quarter using Excel’s built-in What-If Analysis and Scenario Manager tools. This allows fast comparison and decision-making without coding.
2. Quick Ad-Hoc Data Analysis
When immediate insights are needed, Excel allows users to get started without any configuration.
Example: A marketing analyst receives customer feedback in a CSV file. Using Excel, they apply filters, categorize responses, and create a PivotTable to summarize complaints within minutes.
3. Sales and KPI Dashboards for Small Teams
Small teams or companies without access to enterprise BI tools rely on Excel for reporting.
Example: A sales team uses an Excel dashboard with charts, slicers, and conditional formatting to track targets and performance monthly.
4. Data Cleaning Before Uploading to Databases
Analysts often use Excel to clean and prepare data before importing it into SQL or BI tools.
Example: A data analyst removes duplicates, standardizes column formats, and reshapes data using Power Query before uploading it to Power BI.
5. Data Merging from Multiple Sources
Excel simplifies combining datasets from different files or systems.
Example: An HR team collects employee records from various departments and merges them using functions like VLOOKUP and XLOOKUP.
Excel’s Latest Updates: What’s New in 2025?
Microsoft has kept Excel modern and competitive with frequent updates. Here are some recent features:
AI-driven data insights now help detect trends and anomalies automatically.
Python integration is available within Excel, allowing advanced data manipulation using familiar code.
New dynamic array functions like LET and LAMBDA allow for cleaner and more powerful calculations.
Power Query has become more robust, with better performance and a wider range of transformations.
Collaboration is smoother with improved co-authoring and sharing features in the desktop and online versions.
Should You Still Use Excel?
Excel continues to be one of the most accessible and widely used tools in business analysis. While it may not handle big data as effectively as SQL or offer interactive visualizations like Power BI, it provides unmatched flexibility for day-to-day analysis, quick reporting, and team collaboration.
For a data analyst, Excel is not just a beginner’s tool—it’s an essential part of a well-rounded skillset. The smartest analysts don’t rely on one tool; they know when to use Excel, when to query with SQL, and when to present insights with Power BI.
So, if someone tells you Excel is outdated, remind them that millions of decisions in businesses worldwide are still made using it—because it works, and it works well.